
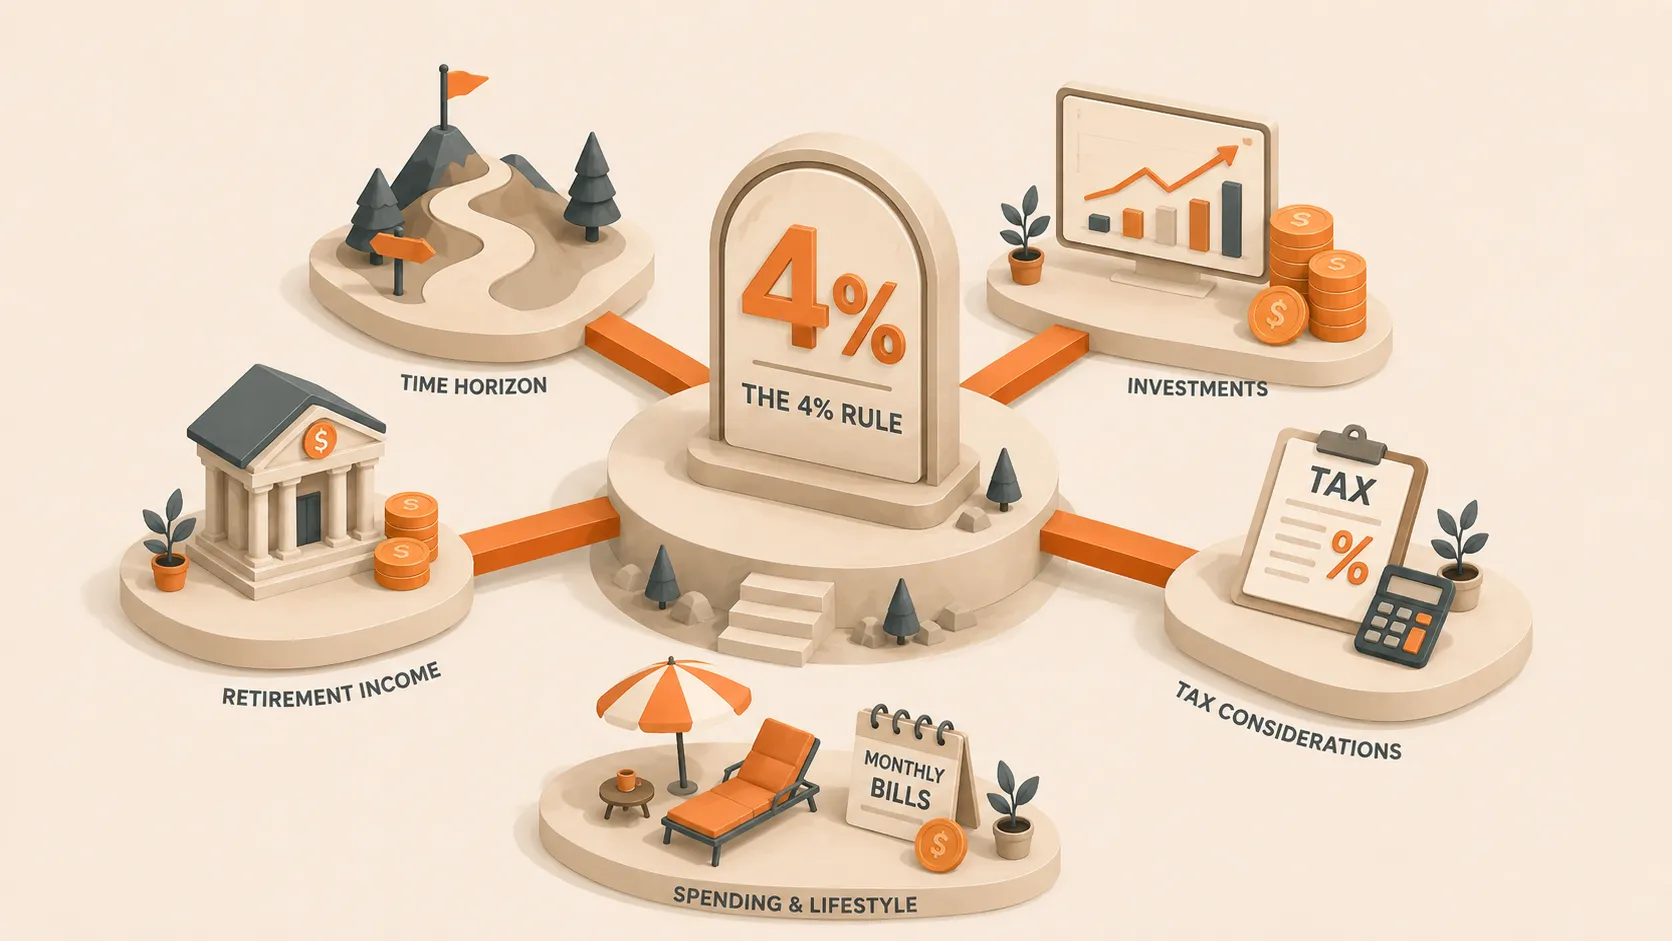
A one-percentage-point change can move a retirement target by €200,000. If you want €40,000 from your portfolio in the first year, 3% needs about €1.33 million, 4% needs €1 million, and 5% needs €800,000.
Define what 4% means
William Bengen’s 1994 analysis used a first-year withdrawal based on the initial portfolio, then increased that euro amount with inflation.[1] Retire with €1 million at 4%, and you withdraw €40,000 in year one. With 3% inflation, you withdraw €41,200 in year two.
That method differs from taking 4% of the current balance every year.
Fixed real spending
Start with 4% of the initial portfolio. Raise the euro amount with inflation. Spending stays steadier in purchasing-power terms, but the withdrawal percentage can rise after a crash.
Percentage of current balance
Withdraw a fixed percentage of the current portfolio. Under the pure percentage formula, withdrawals alone leave the portfolio intact. Spending can still fall sharply after a market decline.
Name the method whenever you quote a withdrawal rate.
Extend the horizon and vary the strategy
Bengen tested historical US data, while Cooley, Hubbard, and Walz tested rates from 3% to 12%, several stock-bond mixes, and 15- to 30-year periods. Both studies excluded taxes and transaction costs.[1][2]
A FIRE plan that starts at 40 may need 50 years. A longer horizon creates more spending years and more chances to meet poor markets, high inflation, or a large one-off cost.
A simple 3% real-return model shows the horizon effect for €40,000 of annual spending:
The smooth model has no volatility, so these figures do not establish a safe withdrawal rate. They show why the funding horizon changes the capital requirement.
A flexible spending rule can help after a drawdown. If your €40,000 budget includes €8,000 of travel, you might cut €5,000 for one year after a 20% fall. Define the rule before retirement and model the spending you would actually accept.
See sequence risk with returns reorderedFollow two retirees with the same wealth and return set as withdrawals push their outcomes apart.Add your real cash flows
A 4% benchmark cannot schedule a €50,000 renovation, start a pension at 67, or account for taxes on different accounts. Put those events on the timeline.
A 4% starting rate also says nothing about whether your portfolio holds 20% or 80% in equities. More growth assets can raise long-term return assumptions and deepen short-term losses. Lower volatility can reduce drawdowns and lower expected growth.
Keep gross withdrawals separate from net spending. Your country, account structure, other income, and withdrawal composition determine the tax gap.
Write “4% initial withdrawal, inflation-adjusted spending, 45-year horizon, chosen portfolio allocation, pension from age 67, and taxes modelled by account.” The longer description tells you what to test.
Turn the benchmark into a projection
- Set the retirement date and planning horizon.
- Enter essential and discretionary spending by year.
- Add pensions and other income when they begin.
- Add one-off expenses and taxes.
- Choose the portfolio allocation and return assumptions.
- Test fixed and flexible withdrawal rules.
- Stress-test poor returns near retirement.
- Compare the result with a later retirement date or lower spending.
Fignis lets you change one decision while holding the rest of the cash-flow model steady. Compare a 3.5% starting rate with 4%, or compare fixed spending with a cut after a crash.
Use 4% to estimate a target and 3% or 5% to measure sensitivity. Then let dates, cash flows, and stress tests decide whether the benchmark fits your life.
Connect the rate to your FIRE targetSee how a single FIRE number compresses pensions, taxes, housing, spending changes, and market risk.